
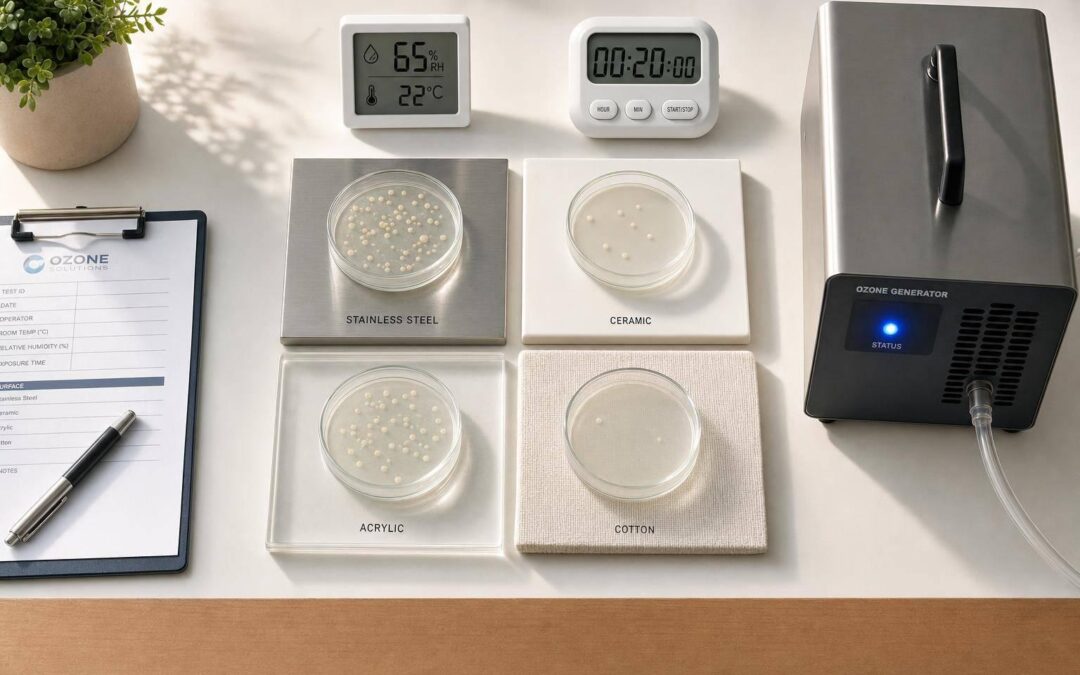
A 4-log ozone result is not just a little better than 2-log – it means 100 times fewer survivors. That’s the main point I’d want you to know before reading any ozone study.
If I strip this topic down to the basics, here’s what matters:
- Log reduction tells you how many germs were removed
- Ct means ozone concentration × contact time
- Humidity changes results a lot
- Water, air, and surfaces do not behave the same way
- Lab numbers do not automatically match room or field use
Here’s the plain-English version:
- 1-log = 90% reduced
- 2-log = 99% reduced
- 3-log = 99.9% reduced
- 4-log = 99.99% reduced
So if you start with 1,000,000 organisms, a 2-log result leaves 10,000, while a 4-log result leaves only 100.
A few study takeaways stand out:
- On surfaces, many viruses needed about 30 to 300 ppm·min for 99% reduction
- For SARS-CoV-2 surface treatment, more than 144 ppm·min brought contamination below detection in about 15 minutes
- Whole-room decontamination needed much more exposure – around 4,800 ppm·min
- In water, viruses were knocked down in 0.2 to 1.0 seconds at 0.1 to 2.0 mg/L
- Higher humidity, such as moving from 55% RH to 85% RH, cut the needed dose by about half in some tests
Humid ozone for effective virus disinfection
sbb-itb-5fea4da
Quick comparison
| Setting | What the data shows | Main takeaway |
|---|---|---|
| Water | Very fast inactivation at low exposure | Do not compare water Ct to room treatment |
| Air/aerosols | Often lower dose than surfaces | Floating particles can respond faster |
| Surfaces | Dose varies by virus, material, and RH | Same ppm can give very different results |
| Whole rooms | Far higher Ct than small tests | Room treatment is a different scale |
If I were reading ozone data for a service job, I’d focus on four numbers first: peak ppm, total minutes, RH, and temperature. Without those, the log-reduction claim does not tell the full story.
How Log Reduction Is Defined and Reported
In ozone disinfection studies, log reduction shows how many microbes are left after treatment. As noted earlier, it’s written as log₁₀(N₀/N), where N₀ is the starting count and N is the count left after treatment.
This is useful because it gives you one clean number for the drop in microbes without running into the limit that percentages have. After all, percentages top out at 100%.
That’s where log reduction helps. A shift from 2-log to 3-log doesn’t just mean a tiny change on paper. It means 10 times fewer survivors, no matter where you started.
What 1-Log to 4-Log Reduction Means in Plain Numbers
Each log reduction cuts the number of survivors by 10x. So if you start with 1,000,000 pathogens, the math looks like this:
| Log Reduction | Percentage Reduction | Pathogens Remaining | Reduction Factor |
|---|---|---|---|
| 1-log | 90% | 100,000 | 10x |
| 2-log | 99% | 10,000 | 100x |
| 3-log | 99.9% | 1,000 | 1,000x |
| 4-log | 99.99% | 100 | 10,000x |
The jump from 2-log to 3-log can seem small if you only look at percentages. But in practice, it means 10 times fewer surviving organisms. In disinfection work, that’s a big deal.
The next sections show how these log levels vary by pathogen, setting, and ozone dose.
Ozone Log Reduction by Pathogen and Setting: What Studies Show
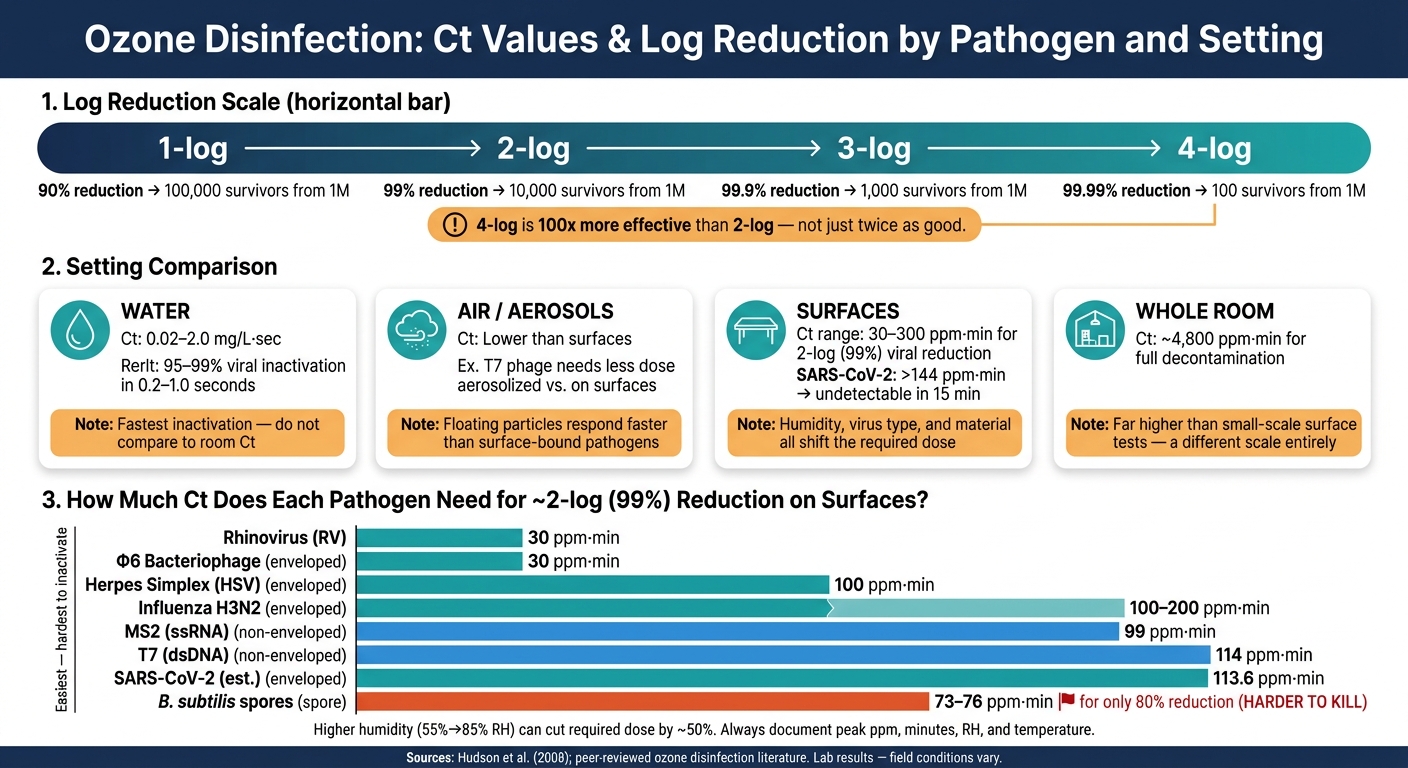
Ozone Disinfection Ct Values by Pathogen & Setting: Log Reduction Guide
Reported log reduction changes with the pathogen, the material or medium involved, the ozone dose, humidity, and contact time. That’s why the same dose can lead to very different results on a countertop, in water, or in room air.
Surface and Room Studies
On solid surfaces, ozone does not behave the same way from one pathogen-material pair to the next. Hudson et al. (2008) found that getting to 99% inactivation of common viruses on plastic, glass, and stainless steel took between 30 and 300 ppm·min, depending on the virus and the surface.
The spread is pretty striking. Rhinovirus on stainless steel needed just 30 ppm·min, while influenza H3N2 on that same material needed 300 ppm·min. Same surface, very different result.
Humidity also made a big difference. When relative humidity went from 55% to 85% RH, the dose needed for 99% viral inactivation dropped by about half. In plain terms, wetter air helped ozone do the job with less total exposure.
For SARS-CoV-2, a Ct value above 144 ppm·min was enough to reduce surface contamination to undetectable levels within 15 minutes. But whole-room treatment was a different story. Using viral surrogates, whole-room decontamination needed a Ct of 4,800 ppm·min. That gap matters. A small surface test can look strong on paper, yet treating an entire room calls for far more ozone exposure.
Bacteria and spores show another sharp split in response. E. coli reached 80% inactivation at 1.78–2.04 ppm·min, while B. subtilis spores needed 73.86–76.41 ppm·min to hit that same endpoint. Spores are clearly much harder to knock down.
Water Disinfection Studies
Water tends to show the fastest inactivation kinetics, and its Ct values should not be compared head-to-head with dry surfaces or airborne treatment.
Katzenelson et al. documented that 95% to 99% of viruses in water could be inactivated within only 0.2 to 1.0 seconds at ozone concentrations of 0.1 to 2.0 mg/L. That is a very short exposure window. Katzenelson et al. also reported faster virucidal action than chlorine.
Put simply, the Ct levels needed in water are much lower than the ones reported for gaseous whole-room decontamination.
Air and Aerosol Studies
Aerosolized pathogens often inactivate more easily than pathogens stuck to a surface. Research on the T7 bacteriophage showed that 99% inactivation needed 114 ppm·min on surfaces, but a lower dose when the pathogen was aerosolized.
Enveloped viruses, including coronaviruses, appear especially sensitive to ozone. At 25 ppm, human coronavirus (HCoV) on glass surfaces showed ≥99% (2-log) reduction within 15 minutes. At 80 ppm with 90% RH, viral inactivation was observed after 60 minutes of exposure. And at 19 ppm, high-humidity conditions of 80% to 95% RH were enough to produce substantial inactivation.
The pattern across these studies is pretty clear: ozone performance depends heavily on the setting. Water acts fast, aerosols can respond at lower doses than surfaces, and whole-room treatment sits in a very different range from small-scale surface tests.
Ct Values and Kinetics: How Ozone Dose Connects to Log Reduction
Why Ct Is Central in Disinfection Studies
Results can swing a lot from one setup to another. That’s why Ct is one of the cleanest ways to compare ozone studies.
Ct means the concentration-time product for ozone. In plain English, a higher dose over a shorter period can match a lower dose over a longer period. What matters most is total exposure, not concentration by itself.
This lines up with the Chick-Watson model for disinfection kinetics. As total Ct goes up, the pathogen population drops, and inactivation tends to slow at higher doses.
Ct also helps explain a common sticking point in this research: the same ozone level can lead to very different log reductions depending on the pathogen and the test setup. Pathogen type, humidity, and test matrix all shift the Ct needed to hit a given log reduction target. You can see those differences clearly in the table below.
Ct and Log Reduction: Study Summary Table
The table below pulls together representative studies to show how Ct, pathogen type, test matrix, and test conditions line up with reported outcomes.
| Pathogen Category | Representative Pathogen | Test Matrix | Humidity (RH) | Temperature | Ct (ppm·min) | Log Reduction | Study Scale |
|---|---|---|---|---|---|---|---|
| Enveloped Virus | Φ6 Bacteriophage | Surface | 55% | 77°F (25°C) | 30 | 2-log (99%) | Lab |
| Enveloped Virus | Influenza H3N2 | Surface | 45% | – | 100–200 | 2-log (99%) | Lab |
| Enveloped Virus | Herpes Simplex (HSV) | Plastic | 45% | – | 100 | 2-log (99%) | Lab |
| Non-Enveloped Virus | MS2 (ssRNA) | Surface | 55% | 77°F (25°C) | 99 | 2-log (99%) | Lab |
| Non-Enveloped Virus | T7 (dsDNA) | Surface | 55% | 77°F (25°C) | 114 | 2-log (99%) | Lab |
| Non-Enveloped Virus | Rhinovirus (RV) | Stainless Steel | 45% | – | 30 | 2-log (99%) | Lab |
| Bacteria | E. coli | Surface | 55% | 77°F (25°C) | 1.78–2.04 | ~0.7-log (80%) | Lab |
| Bacterial Spores | B. subtilis | Surface | 55% | 77°F (25°C) | 73.86–76.41 | ~0.7-log (80%) | Lab |
| Enveloped Virus | SARS-CoV-2 (Est.) | Surface | 55% | – | 113.6 | 2-log (99%) | Room-scale model |
One thing jumps out fast: the Ct needed to reach the same log reduction can differ by orders of magnitude. That shift tracks with pathogen type, test matrix, and humidity. So there isn’t one ozone dose that works across every case.
How to Read Log Reduction Results for Ozone Disinfection Work
Using Research Benchmarks in Professional Service Settings
Once you’ve compared the studies, the next job is putting those benchmarks to work in actual spaces. Research gives you a starting point. The space itself decides what happens next. That’s why lab data needs to be adjusted for field conditions.
A useful benchmark is 300 ppm·min at moderate humidity. That level is enough to achieve a 2-log (99%) reduction for many viral targets on hard surfaces. But that number doesn’t stay neat and tidy once ozone moves into porous materials or a room with an uneven layout.
Carpets, upholstery, curtains, and other porous materials start pulling in ozone the moment treatment begins. This is known as porous-material demand. In plain terms, the ozone level drops early, so the generator has to do more work than it would in a controlled lab setup. That matters a lot in heavily furnished rooms and vehicle interiors, where soft materials can soak up a good share of the dose.
Relative humidity also changes the picture. Higher RH means you need less ozone dose to reach the same log reduction. So, before treatment, it often makes sense to bring humidity up. A pre-treatment target of 50% to 70% RH can improve inactivation.
What to Document to Support Performance Claims
If you want a treatment record that holds up, document the process with the same care as the outcome. At a minimum, record:
- Peak ppm
- Total treatment minutes
- Temperature
- Relative humidity during treatment
Dose alone isn’t enough. Coverage matters just as much. Put sensors at the farthest point from the generator, not only next to the unit. That helps confirm the minimum effective concentration reached the whole space.
Blocked or tucked-away areas, like closets or enclosed compartments, may not hit the same Ct as the middle of the room. So sensor placement should match the full treatment zone, not just the easy-to-reach spots. There’s also a practical ceiling here: material compatibility can limit how far ozone exposure can go in occupied spaces and service work, and that limit should be documented alongside efficacy data.
These benchmarks help connect lab findings to documented field performance.
Conclusion: Key Takeaways on Log Reduction in Ozone Disinfection
Log reduction is the clearest way to compare ozone disinfection across different media.
Ct shows why those log-reduction numbers change. It helps determine whether a treatment reaches a 2-log, 3-log, or 4-log result. In plain terms, more ozone exposure over time leads to greater pathogen reduction.
But the target dose doesn’t stay the same in every setting. Humidity, temperature, surface material, and organic load all affect how much ozone is needed to get the same log reduction.
In practice, these benchmarks only mean something when field conditions are tracked. Published studies give you reference points, not promises. To support a defensible claim, document ozone concentration, exposure time, temperature, and humidity.
With ozone disinfection, the log-reduction target matters less on its own. What matters more is matching that target to measured Ct and documented field conditions.
FAQs
Why is log reduction more useful than percent reduction?
Log reduction is more useful because it gives you a standard, logarithmic way to show how much pathogen inactivation has taken place.
That matters because percent reduction gets clunky at very high decontamination levels. Log values make it easier to show large kill rates in a clear, consistent format and check ozone disinfection performance against industry standards.
Can the same Ct value produce different results in different settings?
Yes. The same Ct value can lead to different results depending on the environment and the conditions at the time of use.
Things like relative humidity, temperature, surface type, and organic contamination or biofilms can change how well ozone works. A Ct value that performs well on a smooth surface may work less well on porous or textured surfaces, or in settings with heavy contamination.
What should I verify before trusting an ozone log-reduction claim?
Prioritize biological indicators instead of relying on chemical concentration alone. They use resistant microorganisms, such as spores, to show whether pathogens were neutralized across the whole space, including hard-to-reach areas.
Also check compliance with standards like ANSI/AAMI/ISO 11138 and ISO 11135, confirm that humidity and temperature were controlled, and make sure surfaces were pre-cleaned so organic debris didn’t reduce ozone effectiveness.
Recent Comments