
Yes – higher humidity often helps ozone inactivate viruses on surfaces. In lab studies, results often improved once relative humidity went above 50%, and some of the strongest results showed up around 70% to 90% RH. But there is no single humidity target that works for every virus, surface, or room.
Here’s the short version:
- Humidity matters, but it is only one part of the result.
- Ozone dose and time matter too, often summed up as CT = concentration × time.
- Surface type matters because fabric, foam, and cracks can block ozone.
- Lab results do not transfer cleanly to homes, cars, RVs, boats, or offices.
- Safety matters because ozone should not be used in occupied spaces.
A few numbers show why this topic is not simple:
- In one PPE study, about 20 ppm ozone worked above 50% RH but failed at about 40% RH under that setup.
- In the same line of research, ≥20 ppm, >70% RH, 70–75°F, and ≥40 minutes led to about a 4-log reduction, or 99.99%.
- In one SARS-CoV-2 study, the inactivation rate rose from about 0.01 to 0.27 log₁₀ per CT unit as RH went from 17% to 70%.
- One device study still reported more than a 6-log reduction at only 45% RH, using 20–25 ppm for 10–15 minutes.
So if you want the plain answer: higher RH often helps, but RH alone does not predict the outcome. You have to read humidity together with ozone level, exposure time, temperature, virus type, test method, and the material being treated.
| Factor | What the article shows |
|---|---|
| Relative humidity | Often better above 50% RH |
| Strong lab ranges | Often around 70%–90% RH |
| Low-humidity results | Can be weak or fail under some setups |
| Same CT, different result | RH can change the outcome a lot |
| Transfer to lived-in spaces | Limited and uneven |
| Safety | Reentry needs meter checks, not smell |
If I had to sum up the whole article in one line, it would be this: humidity can help ozone work better against surface viruses, but only measured conditions and safe clearance tell you what actually happened.
What Studies Report on Humidity, Ozone, and Surface Viruses
Ozone & Humidity: Key Study Results for Virus Inactivation on Surfaces
Enveloped-Virus Studies on PPE and Similar Materials
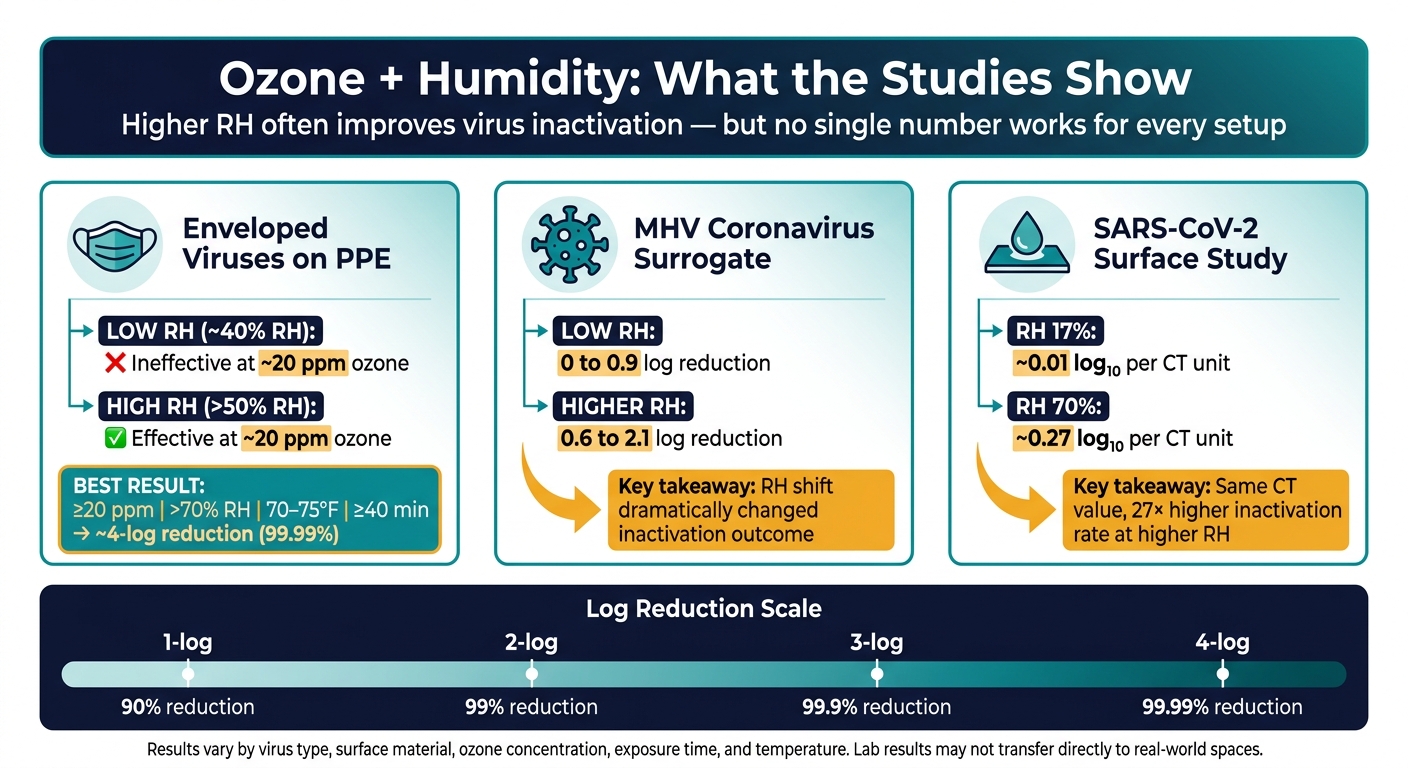
One study on PPE and similar materials found a pretty sharp split by humidity level. At about 20 ppm ozone, inactivation improved above 50% RH and failed at about 40% RH under the tested conditions.
The best outcome in that study came with at least 20 ppm ozone, above 70% RH, 70–75°F (21–24°C), and 40 minutes or more of exposure. Under those conditions, researchers reported a 4-log reduction on the tested PPE. That sounds strong, but there’s an important catch: this result applies only to the specific materials and test setup used in that study.
SARS-CoV-2 and Coronavirus-Surrogate Surface Studies
Studies using SARS-CoV-2 and coronavirus surrogates point in the same general direction: higher RH led to more inactivation.
A study using mouse hepatitis virus (MHV) as a coronavirus surrogate showed weak results at low RH. Under low-RH conditions, the reduction was only 0 to 0.9 log. At higher RH, the result improved to about 0.6 to 2.1 log, with 2.1 log as the best result reported under that study’s conditions.
A separate SARS-CoV-2 surface study tracked how the inactivation rate changed as RH went from 17% to 70%. The rate increased from about 0.01 to 0.27 log₁₀ per CT unit across that range. In plain English, the same CT value – ozone concentration multiplied by exposure time – can lead to very different outcomes depending on how humid the space is.
Cross-Study Pattern: Stronger Results at Higher RH, but No Single Universal Target
Across studies, the pattern is clear enough: higher RH often helps. But there isn’t one RH target that works in every case.
Why not? Because the studies don’t test the same setup. Results shift based on:
- virus type
- surface material
- ozone concentration
- exposure time
- temperature
- how moisture interacts with the contaminated surface
Surface type matters more than many people assume. Porous or absorbent materials can shield contamination from ozone, and the amount of moisture on a surface can change how ozone reacts.
| Evidence Category | Conditions | Reported Result |
|---|---|---|
| Enveloped viruses on PPE | ~20 ppm ozone; ~40% RH | Ineffective under tested conditions |
| Enveloped viruses on PPE | ~20 ppm ozone; RH above 50% | Effective under tested conditions |
| Enveloped viruses on PPE | ≥20 ppm; >70% RH; 70–75°F; ≥40 min | ~4-log (99.99%) reduction on tested PPE |
| MHV coronavirus surrogate | Low RH | ~0–0.9 log reduction |
| MHV coronavirus surrogate | Higher RH | ~0.6–2.1 log reduction |
| SARS-CoV-2 surface study | RH rising from 17% to 70% | Inactivation rate: ~0.01 to 0.27 log₁₀ per CT unit |
That’s why RH alone doesn’t tell the full story. To make sense of it, you have to look at humidity alongside ozone dose, exposure time, temperature, and surface type.
sbb-itb-5fea4da
How to Read Virus Inactivation Research Correctly
Key Metrics: Log Reduction, Ozone Concentration, Exposure Time, and CT Value
Virus inactivation data are easy to misread. Log reduction uses a base-10 scale:
- 1-log = 90%
- 2-log = 99%
- 3-log = 99.9%
- 4-log = 99.99%
Ozone concentration is usually reported in parts per million (ppm) or milligrams per cubic meter (mg/m³). Exposure time is usually given in minutes. On their own, those numbers don’t tell you much.
That’s why researchers use a CT value, which is concentration multiplied by time. It gives a shorthand for total ozone dose. If ozone concentration shifts during treatment, though, CT should be treated as nominal unless the study reports measured or integrated concentration. For example, 6 ppm for 55 minutes gives a nominal CT of 330 ppm·min.
That example also shows the limit of CT. The same nominal CT led to different inactivation rates as RH changed. Surface type, temperature, ozone decay, and how the gas moves through the test space can all change the result.
Dose still does not prove infectivity loss.
Testing against pathogens shows that RNA detection and infectivity testing do not measure the same thing. RNA can still be present after infectivity is gone, and "not detected" does not mean zero. It means the result fell below the assay limit. RNA tests measure presence, not infectivity. Plaque assays and TCID₅₀ measure infectious virus. So before you treat a paper as proof of disinfection, check which method the researchers used.
| Metric | What it measures | Why it’s not enough alone |
|---|---|---|
| Log reduction | Decrease in recoverable infectious virus on a base-10 scale | Depends on assay type, detection limit, and starting virus load |
| Ozone concentration (ppm or mg/m³) | Amount of ozone in the treatment atmosphere | Doesn’t account for decay, shielding, or surface access |
| Exposure time (minutes) | How long the material was exposed | High time at low concentration is not always equivalent to low time at high concentration |
| CT value (ppm·min or mg·min/m³) | Concentration × time | Doesn’t capture RH, temperature, material porosity, or gas distribution |
Why Study Conditions Cannot Be Directly Compared
Once the metrics are clear, the next step is asking a simple question: are two studies even measuring the same kind of setup?
Two studies can use the same ozone concentration and the same exposure time and still report very different log reductions. That’s not automatically a contradiction. More often, it means the test conditions were different in ways that matter. Virus or surrogate choice, test surface, temperature, how RH was measured, how the virus was recovered after treatment, and the assay’s detection limit can all shift the outcome.
Surface material is a good example. Smooth stainless steel gives ozone more even contact and usually makes virus recovery easier than folded fabric or a porous mask. In one study, spun high-density polyethylene fabric at 20 ppm and 80% RH needed only 18 minutes to reach its reported result, while cloth face-mask material under the same nominal conditions needed 90 minutes. Same concentration. Same humidity. Very different exposure times.
The examples below show why identical-looking ozone doses can produce different results.
| Study | Virus / Surrogate | Material | Ozone Conc. | RH | Temperature | Exposure Time | Nominal CT | Reported Result |
|---|---|---|---|---|---|---|---|---|
| Stainless steel study | SARS-CoV-2 | Stainless steel | 6 ppm | Not reported | Not reported | 55 min | 330 ppm·min | 3.30-log reduction |
| Large-volume study | SARS-CoV-2 | Office supplies | 90 ppm | 60%–75% | 21.8–24.7°C (about 71–76°F) | 120 min | 10,800 ppm·min | Best tested condition; no single log reduction reported |
| MNV-1 / PEDV study | MNV-1, PEDV | Plastic | 100 ppm | 95% | 25°C (77°F) | Up to 25 min | 2,500 ppm·min | >99.8% inactivation (>2.7-log) |
These studies are not interchangeable. They test different setups, different materials, and different limits. And those conditions don’t transfer cleanly to lived-in spaces, where humidity can vary from spot to spot and gas penetration is often uneven.
Limits of the Evidence and What It Means for Real Spaces
Why Lab Results May Not Transfer Directly to Buildings, Cars, RVs, or Boats
The same CT value does not guarantee the same result in a house, car, RV, or boat. Real spaces are messy. Labs are controlled. And that gap matters.
Lab conditions don’t match lived-in spaces. Humidity effects seen in studies become less predictable in furnished rooms, car cabins, or boat interiors because ozone delivery shifts with airflow and surface shielding.
Materials inside those spaces can get in the way. Folds, cracks, cushions, carpet, foam, and rubber seals may shield contaminated material from ozone. Dust, skin oils, food residue, and mucus can also use up ozone before it ever reaches the virus. In an EPA home assessment, some generators produced 0.20–0.30 ppm with interior doors closed, while adjacent rooms measured 0.12–0.20 ppm. That kind of spread changes the actual CT value at the surface, which changes the expected virus inactivation result.
Porous or composite materials – like upholstery, foam, and rubber seals – also limit ozone access in ways a smooth laboratory coupon doesn’t show. That’s why treatment success depends on measured conditions, not just the generator setting.
High RH may support inactivation, but in real spaces it can also shift moisture load and surface chemistry. It can bring condensation, corrosion, and microbial growth risk into the picture. So humidity isn’t just a dial you turn up. It has to be managed with care.
Why Controlled Application and Reentry Protocols Matter
Because of those limits, process control is a big deal.
Research-level ozone is unsafe in occupied spaces. ASHRAE states that ozone should only be considered for disinfection in unoccupied spaces, with safe indoor ozone levels below 10 parts per billion (ppb). The EPA has also confirmed that no federal agency has approved ozone generators for use in occupied spaces.
For treatment to mean anything, dosing and reentry need to be documented. Before treatment starts, the space should be checked in one pass, including:
- volume
- starting and target RH
- generator placement
- spots that may not get even coverage, such as under seats, inside cabinets, and HVAC ducts
Military guidance recommends shutting off HVAC systems and sealing air-exchange spaces before treatment begins.
During treatment, ozone and humidity should be measured at multiple spots that reflect the full space, not just the area near the generator. After treatment, the space needs ventilation based on a written procedure. Reentry should happen only after calibrated measurements show that residual ozone has dropped to a safe level.
Smell is not a dependable test. Ozone may still be present at hazardous levels even when most people can’t detect it. Military guidance cites 0.08 ppm as a conservative pre-reentry benchmark and says an average two-hour wait may be enough in some cases, while still requiring meter verification.
In practice, success comes down to measured ozone, measured RH, and verified reentry.
Conclusion: What the Research Tells Us About Professional Ozone Monitoring
Across these studies, higher RH often helped ozone inactivate viruses on surfaces. But it didn’t work the same way every time. The result changed based on the virus, the surface, and the way the test was run. So RH matters, but it isn’t something you can treat like a magic number.
There isn’t one humidity level, ozone dose, or exposure time that works for every virus, every material, and every room. The RH ranges reported across studies aren’t in conflict. They reflect different organisms, different surfaces, and different test conditions. The main point is pretty clear: you need to control and measure the whole process, not fixate on RH alone.
The research points to a disciplined process. Professional ozone work should document RH, temperature, ozone concentration, exposure time, and verified clearance before anyone goes back into the space. That same recordkeeping should apply to reentry clearance too. OSHA‘s permissible exposure limit is 0.10 ppm as an 8-hour time-weighted average, and that limit still applies no matter how well the treatment seemed to work.
Humidity can help ozone perform better, but reliable results come from measured conditions and verified clearance.
FAQs
Why does humidity make ozone work better?
Humidity can help ozone work better because it creates conditions that make microbes easier to break down. At 50% to 70% relative humidity, ozone can react with water vapor and form hydroxyl radicals. Those radicals help damage bacteria and mold.
Moisture can also rehydrate microorganisms and cause spores to swell, which may make them more vulnerable to ozone’s oxidative effects. But there’s a limit. If humidity gets too high, ozone concentration can drop, and the treatment may work less well.
What does CT mean in ozone treatment?
In ozone treatment, CT means the combined effect of ozone concentration and exposure time. You calculate it by multiplying ozone concentration (ppm) by exposure time (minutes).
In simple terms, a higher CT usually means more microorganism reduction. For example, 112 min·ppm equals 1.6 ppm over 70 minutes.
Can lab ozone results be trusted in real rooms?
Yes – but not on its own. Results from a lab can carry over to real rooms when the main conditions stay under control, especially temperature, airflow, and relative humidity.
Lab studies show the baseline level of performance. But results in actual spaces also depend on things like how well the room is sealed, the ozone concentration, and the length of exposure. Humidity can shift the outcome, so professionals rely on biological indicators and real-time monitoring to verify that the treatment worked.
Recent Comments