
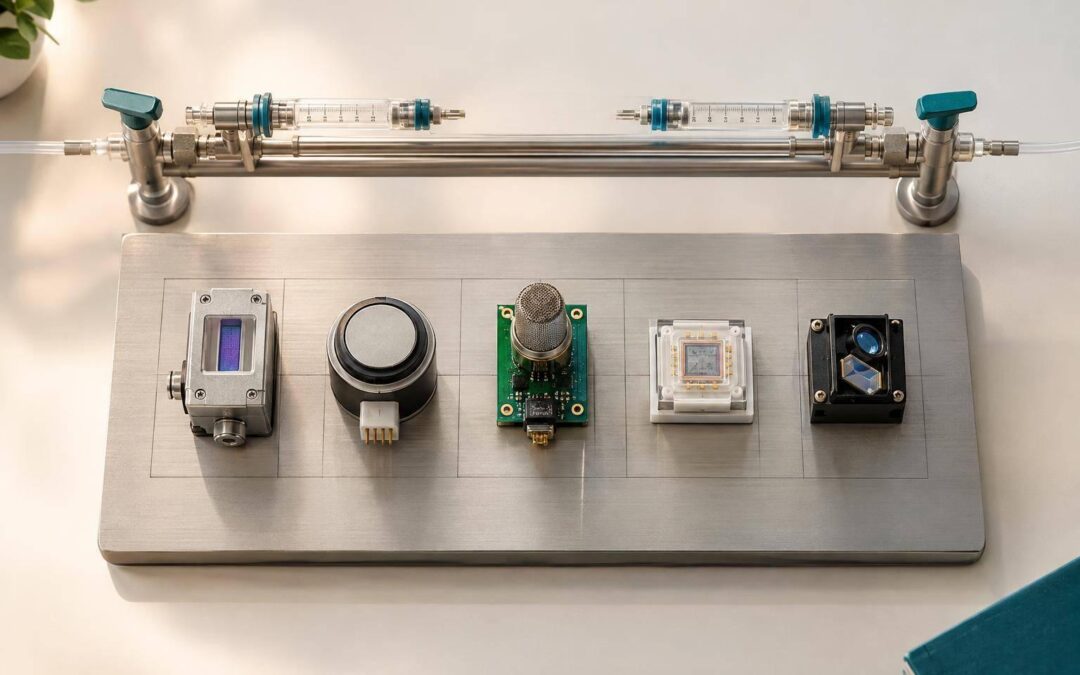
I’d choose an ozone sensor by its verified accuracy – not its smallest displayed number. For treatment and re-entry checks, ask for calibration records, humidity and gas-interference tests, and recovery data after high ozone exposure. 1 ppm = 1,000 ppb, so an instrument suited to treatment levels may not measure low residual ozone well.
Here’s how I compare the designs:
- UV photometric: Established optical measurement, with clean optics and controlled sampling required.
- Electrochemical: Small and low-power, but affected by aging, humidity, and other gases.
- Metal-oxide: Small and often inexpensive, with selectivity and drift to check.
- Nanostructured materials: May detect lower concentrations, but need field testing.
- Compact optical: Smaller optical instruments that still need stable light sources and clean windows.
My bottom line: check accuracy, range, response, recovery, and calibration before software features. <u>Ozone readings alone do not prove safe re-entry, odor removal, or disinfection.</u> Those decisions also need representative sampling, site-specific procedures, and separate checks of treatment results.
Established and Emerging Ozone Sensor Designs
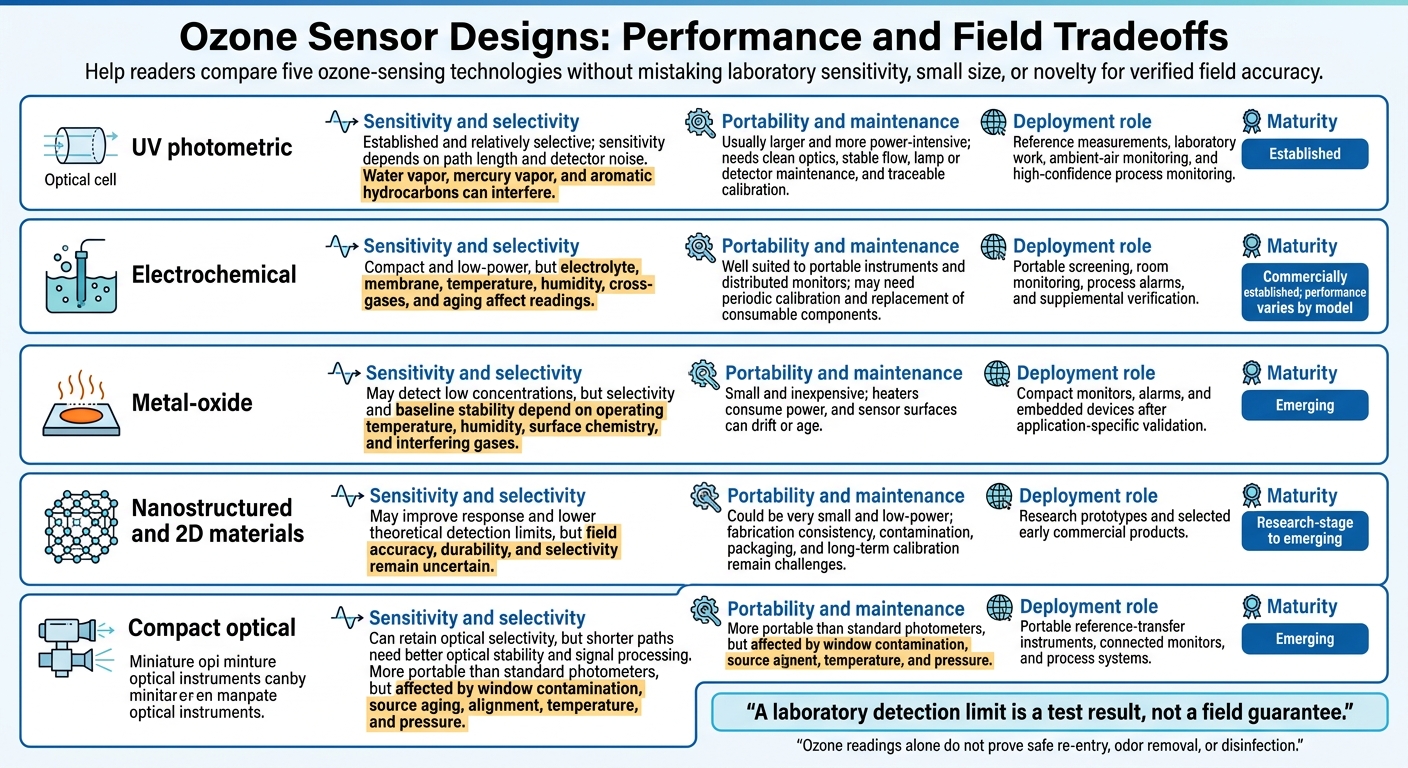
Ozone Sensor Designs: Performance and Field Tradeoffs
Ozone sensor designs balance sensitivity, selectivity, size, field stability, and calibration needs differently. For odor removal and disinfection in event spaces, those tradeoffs determine whether a sensor can verify treatment levels and measure low residual ozone during clearance.
| Design | Sensitivity and selectivity | Portability and maintenance | Deployment role | Maturity |
|---|---|---|---|---|
| UV photometric | Established and relatively selective; sensitivity depends on path length and detector noise. Water vapor, mercury vapor, and aromatic hydrocarbons can interfere. | Usually larger and more power-intensive; needs clean optics, stable flow, lamp or detector maintenance, and traceable calibration | Reference measurements, laboratory work, ambient-air monitoring, and high-confidence process monitoring | Established |
| Electrochemical | Compact and low-power, but electrolyte, membrane, temperature, humidity, cross-gases, and aging affect readings | Well suited to portable instruments and distributed monitors; may need periodic calibration and replacement of consumable components | Portable screening, room monitoring, process alarms, and supplemental verification | Commercially established; performance varies by model |
| Metal-oxide | May detect low concentrations, but selectivity and baseline stability depend on operating temperature, humidity, surface chemistry, and interfering gases | Small and inexpensive; heaters consume power, and sensor surfaces can drift or age | Compact monitors, alarms, and embedded devices after application-specific validation | Emerging |
| Nanostructured and 2D materials | May improve response and lower theoretical detection limits, but field accuracy, durability, and selectivity remain uncertain | Could be very small and low-power; fabrication consistency, contamination, packaging, and long-term calibration remain challenges | Research prototypes and selected early commercial products | Research-stage to emerging |
| Compact optical | Can retain optical selectivity, but shorter paths need better optical stability and signal processing | More portable than standard photometers, but affected by window contamination, source aging, alignment, temperature, and pressure | Portable reference-transfer instruments, connected monitors, and process systems | Emerging |
The sections below explain what supports – or weakens – each design’s reliability in the field.
UV Photometric and Electrochemical Sensors
EPA calibration procedures use dynamic ozone atmospheres measured by UV photometry, with traceability to NIST standard reference photometers. NIST describes reference photometers designed for calibration atmospheres from 0 to 1,000 ppbv. Their standard uncertainty is 2 ppbv from 1 to 100 ppbv and approximately 2% from 100 to 1,000 ppbv. These specifications apply to reference instruments, not typical field monitors.
Contamination, detector noise, unstable flow, and poor temperature or pressure control can reduce performance. EPA materials also identify possible interferences at 254 nm, including water, mercury, aromatic hydrocarbons, hydrogen sulfide, carbon dioxide, and related compounds in certain monitoring situations.
Electrochemical sensors generate current when ozone reacts at an electrode. Before choosing one, request its measurement range, resolution, accuracy, response time, operating humidity and temperature, cross-sensitivity, expected service life, calibration procedure, and alarm repeatability. Also distinguish gas-phase sensors from dissolved-ozone sensors: membranes, electrolytes, bubbles, and liquid chemistry create different failure modes.
Before deployment, compare the sensor with a calibrated reference or transfer instrument at zero and at several concentrations across the intended operating range. Record zero drift, span drift, response after high-ozone exposure, recovery time, and behavior as humidity changes. Neither a low purchase price nor a published detection limit proves that a sensor will perform reliably in the field.
Metal-Oxide and Nanostructured Sensors
Metal-oxide sensors detect resistance changes at a heated or catalytically modified surface. Porous layers and nanostructuring expose more active sites, while catalytic coatings change how reactions occur. These designs may improve low-concentration response and lower detection limits, but water and organic vapors can still occupy or block the same sites.
Ask for repeatability, baseline stability, recovery, mixed-gas, and humidity tests – not just an initial response curve. A laboratory detection limit is a test result, not a field guarantee.
Compact Optics and Connected Monitoring
Miniature UV emitters, photodiodes, short cells, and integrated electronics can make optical instruments smaller. But these designs need low-noise electronics, clean windows, and stable alignment. A stable light source, plus temperature and pressure compensation, also helps maintain reliable readings.
Wireless alarms and data logging make readings easier to access; they don’t improve selectivity. Machine-learning corrections depend on training conditions that reflect actual use. Unfamiliar gas mixtures or sensor aging can cause those corrections to fail. Require traceable calibration and independent comparison measurements, regardless of the software features.
sbb-itb-5fea4da
Keeping Ozone Measurements Reliable
Greater sensitivity helps only when the instrument stays accurate and stable. Assess the full measurement chain, not just the detection limit. During odor removal and disinfection, that difference can determine whether treatment continues or a space is cleared too soon.
| Design attribute | Potential gain | Limits to check |
|---|---|---|
| Higher sensitivity | Detects lower residual ozone and smaller changes | Noise, drift, humidity effects, calibration error |
| Greater selectivity | Reduces responses to other gases | Interference data for the technology and expected gas mixture |
| Faster response | Allows optimal ozone treatment adjustments | Tubing, filter, and software delays; recovery after high exposure |
| Smaller size | Supports portable and distributed monitoring | Sampling control, tolerance to surrounding conditions, service life, calibration access |
Check operating limits, calibration intervals, recovery time, service life, and replacement cost.
Humidity, Temperature, and Gas Interference
Cold winter ventilation can bring dry air into heated rooms, while humid summer conditions add condensation risk in basements, vehicles, and RVs.
Humidity, temperature, and pressure can change sensor response and flow measurements. Stay within the specified operating limits, and let the instrument stabilize before relying on its readings.
Check technology-specific interference data for chlorine, chlorine dioxide, nitrogen dioxide, and hydrogen sulfide. Look at the tested concentrations, humidity, and exposure duration. These gases are not universal interferents; their effects depend on the sensing technology and test conditions.
Contamination can shift the baseline or weaken response. Excessive ozone exposure can cause saturation, slow recovery, or permanent damage. Follow the manufacturer’s clean-air recovery procedure, record exposure and recovery time, and complete the required checks before reuse. Remove the instrument from service if its baseline won’t stabilize or it fails acceptance limits. These checks prepare it for the calibration steps below.
Sensor Checks and Traceable Calibration
A zero check verifies baseline response in ozone-free air. A span check compares the reading with a known ozone concentration. A bump test confirms response and alarms – not accuracy.
Calibration sets or corrects the relationship between readings and known concentrations. Independent verification compares the instrument with a separate, accurate reference. EPA guidance treats zero and span checks as drift checks against the existing calibration curve, not replacements for calibration.
For measurements that must withstand review or meet regulatory requirements, use a calibration chain traceable to NIST’s Standard Reference Photometer infrastructure. EPA’s ozone reference procedure recommends at least five concentration points across the calibration range.
- Before each treatment: Check power, contamination, damage, and calibration status. Set check intervals based on manufacturer instructions, application risk, and applicable requirements.
- Document checks: Record the instrument ID, location, local date and time, surrounding conditions, reference concentrations, observed readings, adjustments, acceptance limits, technician, and exposure history.
- After excessive exposure: Perform the manufacturer-recommended recovery checks. Obtain independent verification when safety decisions depend on the result; compensation for surrounding conditions does not replace verification.
Use verified readings to monitor ozone treatment effectiveness, track ozone decay, and decide when re-entry is safe.
Using Sensors in Odor Removal and Disinfection
After calibrating readings, use them throughout the treated space. High-sensitivity sensors matter most where airflow varies and residual ozone needs to be checked in specific zones. For Chicagoland spaces served by Ozonated Cleaning LLC, future designs could improve residual-ozone tracking and location-stamped logs. Ozone sensors do not measure hydroxyl treatment, as these represent different cleaning methods.
Tracking Treatment Levels and Residual Ozone
Measure several zones – not just the area near the generator. Furnishings, partitions, and enclosed compartments can cause uneven exposure. Place sensing points at breathing locations, in areas with little airflow, and inside enclosed compartments. Record each location, peak reading, decay, treatment time, door position, temperature, and humidity.
For remote sampling, use short, ozone-compatible tubing within the manufacturer’s limits. Tubing can consume ozone and delay readings, so compare direct and remote readings when possible. Use separate instruments if one unit cannot measure both treatment levels and residual concentrations. These readings guide the clearance decision.
Re-Entry Decisions and Treatment Results
Ozone is a respiratory hazard. Treatment requires a controlled, unoccupied space. Keep people and animals out and restrict access. Check shared HVAC paths and connected spaces to protect nearby occupied areas.
After ozone generation stops, follow the ventilation plan. Measure representative locations with a suitable instrument that has been checked. Apply site-specific clearance criteria and verify clearance before anyone re-enters. Seek independent verification when vulnerable occupants, unusual layouts, incidents, or disputed readings call for it.
Readings alone do not prove treatment worked. Ozone readings document exposure; they do not prove disinfection or guarantee odor removal. Results also depend on contact time, humidity, airflow, surface access, organic load, and material compatibility.
Pair monitoring with checks that confirm odor sources were removed, material inspections, and an odor check after ventilation. When a validated disinfection claim is required, use an appropriate independent test – not the ozone decay curve.
Conclusion: Choosing Sensors for Reliable Monitoring
As sensor designs improve, choose based on field performance – not novelty. A lower detection limit isn’t enough. Weigh sensitivity alongside accuracy, selectivity, stability, response time, and usable range. High sensitivity matters only when it helps with residual-ozone checks and clearance decisions in the field.
New designs need field validation before they can support safety-critical decisions. Monitoring informs those decisions; it does not prove safety or treatment effectiveness.
Sensor Selection Checklist
For odor removal and disinfection, match the sensor to the space, the ozone range, and the safety decision it supports.
- Start with the measurement purpose and concentration range, including peaks and residuals.
- Require stated uncertainty and overload behavior – not just display resolution. Request humidity, temperature, and gas-interference performance data for conditions that match the application.
- Require written calibration procedures covering acceptance limits, zero and span checks, failure responses, and traceability to a NIST-traceable reference photometer.
- Keep certificates, raw readings, records of surrounding conditions, and corrective actions. Set check, calibration, and maintenance intervals based on manufacturer instructions, exposure history, and measured drift.
- Assess alarms, remote access, and data logging last. Treat faults and missing data as invalid readings.
- Before approval, arrange independent verification under actual operating conditions, including rising and falling concentrations, for decisions affecting safety or treatment acceptance.
FAQs
How do I choose an ozone sensor’s accuracy range?
Match the sensor’s accuracy range to the ozone levels and conditions you expect. Heated MOS (HMOS) sensors can measure below 0.1 ppm, but accuracy at low levels is best with technologies designed for that range. Electrochemical (EC) sensors work best above 0.1 ppm, up to about 20 ppm.
For the highest precision across a broad range, choose UV absorption/reference-grade monitors, which offer about 1% accuracy with little interference. Calibrate regularly and verify performance.
What ozone clearance criteria apply to my space?
Use a calibrated ozone monitor – not your sense of smell – to check whether a space is ready for re-entry. OSHA and NIOSH exposure guidelines cite 0.1 ppm; a level below 0.08 ppm is recommended as a cautious clearance target.
After ozone generation and enough contact time for disinfection, ventilate the space with outdoor air. Before letting anyone back in, use the monitor to confirm that residual ozone is below these thresholds.
When should I replace rather than recalibrate my sensor?
Replace your ozone sensor when it reaches the end of its service life – typically 12 to 18 months for electrochemical sensors – or when standard field or factory calibration can’t correct persistent drift. You’ll also need to replace it if aging or conditions where it’s used push its accuracy outside your required tolerance.
Keep up with regular maintenance and calibration, but don’t rely on them to fix a sensor that no longer works reliably. That sensor needs replacement to maintain safety and effective disinfection.
Recent Comments